Analytics turns marketing from educated guesswork into measurable, optimisable investment. When you instrument your campaigns, website, and CRM correctly, every pound of budget has a traceable path to revenue. Tools like Google Analytics 4 (GA4) and customer data platforms give you the data foundation to understand which channels drive real conversions, not just clicks. Data-driven marketing bridges intuition and evidence, replacing assumptions with decisions grounded in actual customer behaviour.
- What analytics delivers: measurable ROI, clearer customer insight, and the ability to reallocate budget toward what works.
- Key enablers: GA4 for web event tracking, a CRM for first-party customer data, and a single dashboard to connect both.
- Your immediate next step: define one priority conversion goal, instrument it as a GA4 event, and set a monthly review date to act on what you find.
Key takeaways
Analytics turns marketing spend into measurable, optimisable investment when you instrument the right data sources, track the metrics that connect to revenue, and review findings on a consistent monthly cadence.
| Point | Details |
|---|---|
| Start with one goal | Define a single conversion goal, instrument it in GA4, and measure it for 90 days before expanding. |
| Data quality before volume | One in seven marketers experienced financial losses from poor data quality; fix hygiene before adding more sources. |
| Match tool to team | SMEs should start with GA4 and HubSpot; add Power BI or Tableau when cross-source reporting becomes the bottleneck. |
| Attribution needs clean IDs | Consistent UTM naming and user ID matching across CRM and web analytics is the foundation of any attribution model. |
| Fyldedigital | Fyldedigital offers discovery audits, KPI workshops, and 90-day pilots to help UK SMEs build trusted marketing measurement. |
Table of Contents
- What is the role of analytics in marketing?
- What are the core benefits of marketing analytics for your business?
- What are the four types of marketing analytics?
- Which data sources and metrics should you track?
- Which analytics tools should you use?
- How do you implement marketing analytics in six steps?
- What are the most common analytics challenges and how do you fix them?
- UK SME examples: what does analytics look like in practice?
- What trends are shaping marketing analytics right now?
- A practitioner’s view on prioritising analytics work
- Fyldedigital can help you get more from your marketing data
- Sources
What is the role of analytics in marketing?
Marketing analytics is the practice of collecting, processing, and interpreting data from your marketing activities to measure effectiveness, understand customers, and improve outcomes. Its scope runs from campaign performance and attribution through to customer lifetime value (CLV) and predictive audience modelling.
The data types it draws on include:
- First-party data: website events, CRM records, email engagement, and purchase history you own directly.
- Ad-platform data: impressions, clicks, cost-per-click, and conversion data from Google Ads, Meta, and LinkedIn.
- Transactional data: point-of-sale (POS) records, e-commerce orders, and subscription events.
- Behavioural data: session recordings, heatmaps, and on-site interaction patterns.
- Attitudinal data: survey responses, NPS scores, and customer satisfaction ratings.
- Third-party data: audience segments and market research from external providers (increasingly restricted post-cookie deprecation).
The data pipeline runs in four stages: sources (web, CRM, ad platforms, POS) feed into processing and identity resolution (matching user IDs across channels), which produces insight (dashboards, reports, models), which then drives action and activation (budget reallocation, personalised messaging, campaign optimisation). Each stage depends on the one before it. Skipping identity resolution, for example, means your attribution model counts the same customer as three separate people.
What are the core benefits of marketing analytics for your business?
The clearest business case for analytics is this: when marketers use data to guide decisions, many marketers report improved efficiency when using data-driven strategies, but some have experienced financial losses linked to poor data quality. The upside is real, but so is the cost of doing it badly.
The core benefits break down as follows:
- Better customer insight: you understand who buys, why they buy, and what stops others from converting. This feeds sharper segmentation and more relevant messaging.
- Improved ROI: you can calculate cost per acquisition (CPA) and compare it against CLV, so budget decisions become financial ones rather than instinctive ones.
- Budget optimisation: channel-level attribution shows which spend is generating returns and which is not, letting you shift budget in near real time.
- Personalisation at scale: behavioural data powers dynamic content, triggered email sequences, and retargeting audiences that respond to what customers have already done.
- Faster learning cycles: A/B test results, cohort analyses, and funnel drop-off reports compress the time between a hypothesis and a confirmed answer.
For CMOs and business leaders, each benefit maps directly to a financial outcome. Better customer insight reduces churn. Improved ROI justifies marketing spend to the board. Budget optimisation cuts waste. Personalisation increases average order value. Faster learning means fewer expensive campaigns built on untested assumptions.
Advanced analytics integrated into decision workflows can deliver a sustainable competitive advantage, particularly when it connects marketing data to sales and operational data across the business.
What are the four types of marketing analytics?
Understanding the analytical ladder helps you invest in the right capability for your current goals. Data-driven marketing typically progresses through four levels:
- Descriptive analytics answers “what happened?” — traffic reports, campaign reach, revenue by channel. Most teams start here and it remains the foundation for everything else.
- Diagnostic analytics answers “why did it happen?” — cohort comparisons, funnel drop-off analysis, and attribution breakdowns that explain the cause behind a metric movement.
- Predictive analytics answers “what is likely to happen?” — churn propensity models, lead scoring, and demand forecasting built on historical patterns.
- Prescriptive analytics answers “what should we do?” — budget allocation recommendations, next-best-action engines, and automated bidding strategies that act on predictions.
Smaller teams should focus on descriptive and diagnostic first. Getting a reliable, consistent picture of what is happening is worth more than a predictive model built on inconsistent data. Once your descriptive layer is trustworthy and your diagnostic processes are repeatable, predictive modelling starts to pay off.
Pro Tip: Stop progressing up the maturity ladder the moment the next level requires data you do not yet collect reliably. A predictive model trained on patchy CRM data will produce confident-sounding wrong answers. Fix the data feed before you build the model.
Which data sources and metrics should you track?
Your instrumentation checklist should cover these sources before you build any dashboard:
- GA4 web analytics (page events, conversion goals, user journeys)
- CRM data (lead stage, deal value, close rate, customer tenure)
- Ad platform data: Google Ads, Meta Ads Manager, LinkedIn Campaign Manager
- Email platform metrics: open rate, click-to-open rate, unsubscribe rate, revenue per send
- POS or e-commerce platform: order value, repeat purchase rate, product-level margin
- Product event data: in-app actions, feature adoption, trial-to-paid conversion
- Survey and NPS data: satisfaction scores, purchase intent, brand perception
For monitoring SEO performance alongside paid channels, you also need Google Search Console data feeding into the same reporting layer.
| Metric | Definition | Who cares | Typical use |
|---|---|---|---|
| Cost per acquisition (CPA) | Total spend divided by conversions | Marketing, Finance | Budget efficiency and channel comparison |
| Customer lifetime value (CLV) | Projected revenue from a customer over their relationship | Finance, Marketing | Justify acquisition spend; set CPA ceiling |
| Return on ad spend (ROAS) | Revenue attributed to ads divided by ad spend | Marketing, Finance | Paid media optimisation |
| Conversion rate | Conversions divided by sessions or clicks | Marketing | Landing page and funnel optimisation |
| Customer acquisition cost (CAC) | Total sales and marketing cost divided by new customers | Finance, Leadership | Unit economics and growth model |
| Bounce rate / engagement rate | Sessions with no meaningful interaction (GA4 uses engagement rate) | Marketing | Content quality and UX signals |
| Email click-to-open rate (CTOR) | Clicks divided by opens | Marketing | Message relevance and offer quality |
| Net Promoter Score (NPS) | Likelihood to recommend, scored 0–10 | Marketing, CX | Brand health and retention risk |
Instrumentation note: consistent naming conventions matter more than most teams realise. If your CRM records a lead source as “Google” while GA4 records it as “google / cpc”, your attribution model will treat them as different channels. Agree a single taxonomy for UTM parameters, event names, and user IDs before you connect any tools. This single decision saves weeks of reconciliation work later.
Which analytics tools should you use?
The right tool depends on your team’s skill level, your data volume, and what decisions you need to make. The trade-off is usually between turnkey simplicity (fast to deploy, limited flexibility) and integrated depth (more powerful, higher skill requirement). Nearly half of business leaders report that their data is too complex or hard to access, which is why tool selection and data architecture matter as much as the analytics itself.
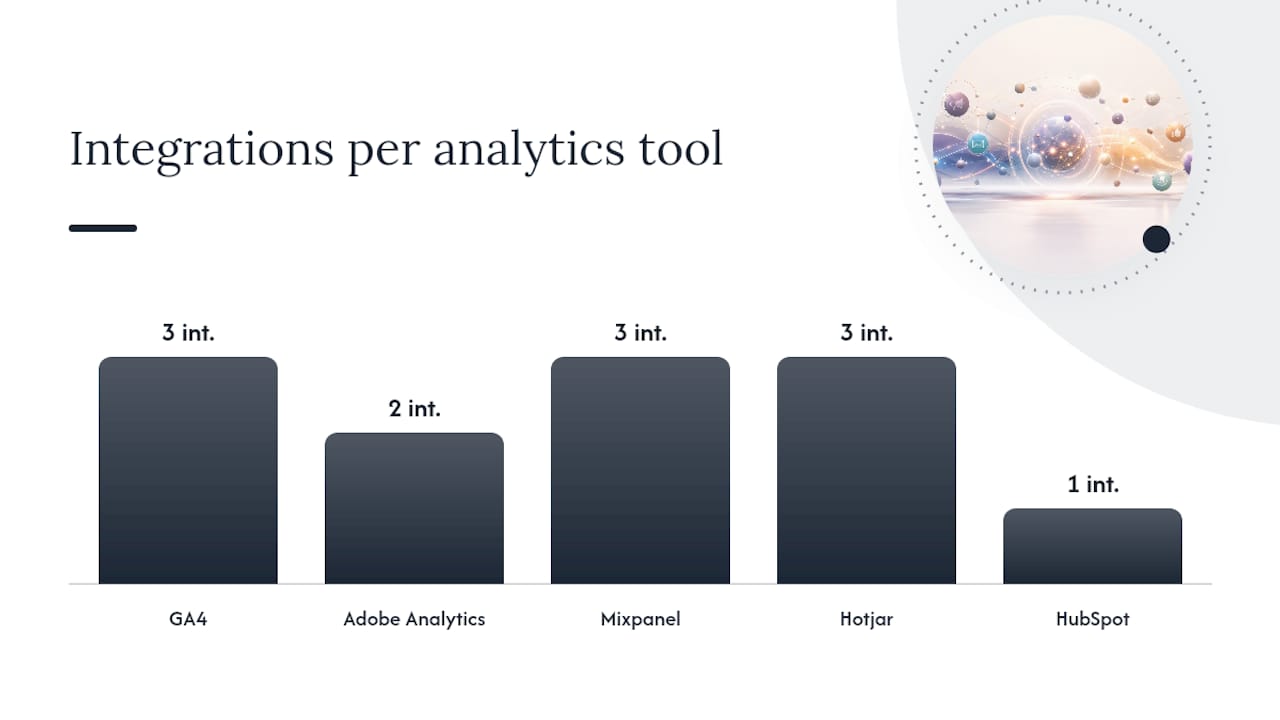
| Tool | Best for | Pricing level | Data types | Key integrations | Skill required | Reporting capability | GDPR / governance |
|---|---|---|---|---|---|---|---|
| GA4 | Web and app event analytics | Free | Web, app, e-commerce events | Google Ads, BigQuery, Looker Studio | Low to medium | Strong dashboards; custom reports | Data retention controls; consent mode v2 |
| Adobe Analytics | Enterprise web and cross-channel analytics | High (enterprise contract) | Web, mobile, CRM, streaming | Adobe Experience Cloud, CDP | High | Advanced segmentation and pathing | Robust; DULE labels, data governance framework |
| Mixpanel | Product and event analytics | Free tier; paid scales by events | Web, mobile, product events | Segment, Salesforce, Slack | Medium | Funnel and retention reports | GDPR-compliant; data deletion APIs |
| Hotjar | Behavioural and UX research | Free tier; paid from ~£32/month | Heatmaps, session recordings, surveys | GA4, HubSpot, Slack | Low | Visual heatmaps; session replays | Consent-based recording; GDPR-ready |
| HubSpot | CRM, marketing automation, and attribution | Free CRM; paid hubs from ~£41/month | CRM, email, web, ads | Google Ads, Salesforce, Zapier | Low to medium | Contact-level attribution; revenue reports | GDPR consent tools built in |
| Salesforce | Enterprise CRM and sales analytics | High (per-user licensing) | CRM, sales, service, marketing | Marketing Cloud, Tableau, GA4 | High | Einstein Analytics; custom dashboards | Comprehensive; field-level security |
| Tableau | BI visualisation and cross-source reporting | Mid to high (per-user or site) | Any source via connectors | Salesforce, Google, SQL, Excel | Medium to high | Best-in-class visual analytics | Row-level security; governance via Tableau Server |
| Microsoft Power BI | BI reporting within Microsoft ecosystems | Free desktop; Pro from ~£8.40/user/month | Any source; strong Microsoft stack | Excel, Azure, Dynamics, GA4 | Medium | Strong dashboards; Power BI connectors cover most data sources | Row-level security; Microsoft Purview integration |
Recommendation by team size:
- SME starting out: GA4 plus HubSpot CRM covers web analytics and contact-level attribution without significant cost. Add Hotjar for UX insight once you have baseline traffic.
- Growing mid-market team: connect GA4 and your CRM into Power BI or Looker Studio for cross-channel reporting. Mixpanel adds depth if you have a product or app.
- Enterprise or high-volume: Adobe Analytics or Salesforce with Tableau gives the governance and segmentation depth that large data volumes require.
- Briefing an agency for a first workshop: ask them to audit your GA4 configuration, review your UTM taxonomy, and map your CRM-to-web identity resolution before touching any reporting layer.
How do you implement marketing analytics in six steps?
Implementation works best as a sequence. Jumping straight to dashboards without fixing the data underneath produces reports that look authoritative but mislead.
-
Define goals and KPIs. Start with the business question, not the metric. “We want to reduce CPA by 20% in Q3” is a goal. “We want to track sessions” is not. Assign a metric owner for each KPI. Marketing owns conversion rate and CPA; Finance owns CAC and CLV; leadership owns revenue attribution.
-
Map your data and instrumentation. Audit every data source against your KPI list. Identify gaps: missing UTM parameters, untracked form submissions, CRM fields that are never populated. Document the gaps before building anything.
-
Consolidate data. For most UK SMEs, connecting GA4 to a CRM via a tool like HubSpot or using Looker Studio as a free reporting layer is sufficient. Larger teams should consider a data warehouse (BigQuery, Snowflake) or a customer data platform (CDP) for identity resolution across channels. Customer data analytics for continuous improvement depends on this unified foundation.
-
Build dashboards and attribution. Create one primary dashboard per audience: a channel performance view for the marketing team, a revenue attribution view for leadership, and a UX/conversion view for the web team. For attribution, start with last-click to establish a baseline, then move to data-driven attribution in GA4 once you have sufficient conversion volume (typically 300+ conversions per month per channel).
-
Act and optimise. Analytics only creates value when it changes a decision. Set a monthly review cadence where the marketing team reviews the dashboard, identifies the single biggest lever, and makes one change. Teams that review data consistently are the ones that gain measurable ROI; those that build dashboards and never revisit them do not.
-
Close the loop and iterate. Feed outcomes back into your models. If a campaign drove high-volume leads but low close rates, that diagnostic insight should change your next audience brief, not just your ad creative.
ROI formula example: if your Google Ads campaign spent £5,000 and generated 50 leads, your CPA is £100. Your ROAS is 2:1. The question analytics then answers is: which channel, audience, or creative produced the leads with the highest close rate, not just the highest volume?
For measuring PPC success specifically, this CPA-to-CLV comparison is the single most useful calculation you can run.
What are the most common analytics challenges and how do you fix them?
Most analytics failures are not technology problems. They are process and governance problems that technology then amplifies.
- Poor data quality: implement validation rules at the point of data entry (required CRM fields, UTM enforcement via a URL builder, GA4 event QA in Tag Manager). Adobe’s analysis found one in seven marketers experienced financial losses attributable to poor data quality — a figure that makes data hygiene a financial priority, not a technical one.
- Data siloes: agree API contracts between your CRM, ad platforms, and web analytics. A CDP or a lightweight connector like Zapier can bridge systems without a full data engineering project.
- Skills gaps: analytics literacy varies widely across marketing teams. Pair a technically confident analyst with a commercially focused marketer. The analyst builds the model; the marketer asks the business question. Neither alone produces useful output.
- Attribution complexity: multi-touch attribution requires significant data volume and clean identity resolution. Start with last-click, document its limitations, and upgrade to data-driven attribution when volume justifies it.
- Lack of review cadence: dashboards that no one reviews become shelfware. Assign a named owner for each dashboard and a fixed monthly slot to act on findings.
UK compliance note: under UK GDPR, you must have a lawful basis for processing personal data in marketing measurement. Consent is the most common basis for behavioural tracking via cookies. The ICO’s guidance on cookies and similar technologies sets out what constitutes valid consent and how to configure consent management platforms (CMPs) correctly. GA4’s Consent Mode v2 is the current standard for UK web analytics compliance, passing anonymised signals when users decline tracking rather than dropping the data entirely.
UK SME examples: what does analytics look like in practice?
Case summary 1: local e-commerce retailer
A Lancashire-based homeware retailer was spending equally across Google Ads and Meta Ads with no attribution beyond last-click. The intervention was instrumentation and attribution, not creative or audience work.

Case summary 2: B2B professional services firm
A three-week data hygiene project, combined with retrospective UTM matching from email history, recovered source attribution on 1,800 contacts.
What to expect from an analytics engagement with an agency:
- Data audit: a review of your GA4 configuration, CRM data completeness, and UTM hygiene. This typically surfaces three to five fixable issues within the first week.
- KPI workshop: a session to align marketing, sales, and finance on the two or three metrics that actually matter for the business goal. More than five KPIs on a primary dashboard is usually a sign that no one has made a prioritisation decision.
- Instrumentation plan: a documented list of events to track, naming conventions to adopt, and integrations to connect, with owners and timelines.
- Pilot test: a 90-day period tracking one channel or campaign end-to-end, from audience definition through to CPA and CLV calculation.
For guidance on how agencies structure these engagements, what marketing consulting involves for SMEs is a useful starting point.
What trends are shaping marketing analytics right now?
The analytics environment is changing faster than most teams’ internal capability can keep up with. These are the trends with the most immediate practical implications:
- AI-powered analysis: AI tools can now surface anomalies, generate natural-language summaries of dashboard data, and suggest next actions. The practical step: audit which of your current reporting tasks could be automated, and free analyst time for interpretation rather than data pulling.
- Agentic analytics: AI agents are shifting analytics from retrospective reporting to continuous decisioning, monitoring data streams and taking actions without waiting for a human review cycle. For most SMEs, this is 12–24 months away from being practical, but understanding CDPs and unified data foundations now puts you ahead of the curve.
- First-party data imperative: with third-party cookies largely deprecated across major browsers, your owned data (email lists, CRM, logged-in user behaviour) is your primary measurement asset. Audit your first-party data collection points now and identify gaps before a campaign depends on them.
- Real-time personalisation: platforms like HubSpot and Salesforce Marketing Cloud can serve personalised content based on live behavioural signals. The differentiator is not the technology but the content and audience strategy behind it.
- Privacy-preserving measurement: server-side tagging, GA4 Consent Mode v2, and modelled conversions are replacing client-side cookie tracking. Brief your web developer or agency on server-side GA4 implementation if you have not already.
- Composable data architectures: larger teams are moving toward warehouse-native analytics (BigQuery, Snowflake with dbt) rather than monolithic platforms. This gives more flexibility but requires data engineering capability. Leveraging data analytics for business growth at this level requires a clear data strategy before any architecture decision.
A practitioner’s view on prioritising analytics work
The most common mistake I see marketing teams make is trying to do everything at once. They instrument 40 events in GA4, build a 12-metric dashboard, and then spend three months arguing about which numbers are correct. Nothing changes. No decisions improve.
The right sequence is simpler than most guides suggest. Fix one data feed completely before you add another. Build one dashboard that everyone trusts before you build a second one. Make one decision based on data each month, document what happened, and use that as the evidence base for the next decision. That cadence, repeated consistently, produces more measurable improvement than any technology investment.
Prioritisation checklist for busy teams:
- Instrument the highest-impact funnel point first (usually the conversion event closest to revenue).
- Fix data hygiene on your CRM lead source field before building any attribution model.
- Create one dashboard that marketing, sales, and finance all agree on. Disagreement about the numbers is a governance problem, not an analytics problem.
- Set a monthly review date and protect it. Analytics without a review cadence is just data storage.
- Defer predictive modelling until your descriptive layer has been stable and trusted for at least three months.
On change management: analytics adoption fails when it is positioned as a marketing team initiative. The teams that get the most from data are the ones where finance validates the CLV model, sales trusts the lead quality scores, and leadership uses the attribution report in budget conversations. Getting those stakeholders into the KPI workshop early is not a nice-to-have. It is what determines whether the analytics work actually changes anything.
Understanding which digital metrics to track is the practical starting point for that stakeholder alignment conversation.
Fyldedigital can help you get more from your marketing data
Most UK SMEs have more data than they realise and less clarity than they need. Fyldedigital works with small and medium-sized businesses across the UK to close that gap, connecting web analytics, SEO, PPC, and social media performance into a picture that actually informs decisions.
The starting point is a structured discovery process: a data audit to identify what you are tracking and what you are missing, a KPI workshop to align your team on the metrics that matter, and a 90-day pilot that tracks one channel or campaign end-to-end. By the end of the pilot, you have a working attribution model, a trusted dashboard, and a clear view of which spend is generating returns.
Fyldedigital’s services span web design and development, SEO, PPC management, and social media, with measurement built in from the start rather than bolted on afterwards. If you want to know where your marketing budget is actually going and what it is producing, get in touch with Fyldedigital to request a free analytics audit.
Sources
- Data and analytics for marketers | American Marketing Association
- What 400 successful marketers reveal about data-driven marketing | Adobe Business
- Analytics for marketers | Harvard Business Review
- What Is Data-Driven Marketing? | Coursera